


Most people assume Q4 is the busiest time of year. But assumptions aren’t analysis.
Every business experiences seasonality differently. Understanding your specific demand patterns—when performance surges or slumps—is how you allocate budgets smarter, optimize campaigns, and predict what’s next.
You don’t need a data science team. You don’t need a PhD in statistics. You need a clean export, a bit of prep, and GPT. Let’s break down how to do seasonality analysis using ChatGPT.
This approach draws heavily on insights shared by Cory Lindholm during one of my PPC Town Hall podcasts, where he talked about seasonality analysis, offering a straightforward way to sharpen your PPC strategy.
What is seasonality analysis?
Seasonality analysis is about pattern recognition. It uncovers recurring spikes and dips in performance over time, helping you stop reacting and start planning.
If you’ve ever wondered:
- “Why did conversions tank last May?”
- “When should I start ramping budgets for the holidays?”
- “Are these results an outlier or a trend?”
Then you’re already looking for seasonality. A formal analysis just answers those questions with data, not guesswork.
What is seasonality decomposition?
It’s the process of splitting your time series data into three parts:
- Trend – the long-term movement (up or down)
- Seasonality – the predictable ups and downs (e.g., Q4 spikes)
- Residual – the randomness (e.g, a one-off campaign anomaly)

Two models are commonly used:
- Additive: when changes stay consistent
Y(t) = T(t) + S(t) + R(t) - Multiplicative: when changes grow with volume
Y(t) = T(t) × S(t) × R(t)
That’s the math out of the way. Here’s how GPT does the heavy lifting for you.
How to perform a seasonality analysis using GPT
Here’s the step-by-step process I followed, including a few important checks to ensure reliable results.
Step 1: Export your weekly PPC data

Start with Google Ads Report Editor. Create a report that includes the metrics you want to analyze, such as clicks or conversions, and include “Week” as a row dimension. This creates the time series structure needed for analysis.
Export the report as a CSV file. To get the most out of GPT’s analysis, use at least one full year of weekly data. Seasonality decomposition relies on repeated patterns, so anything shorter may produce misleading or incomplete results.
Step 2: Ensure your data is clean and complete
Before uploading the file, review your data for inconsistencies. Check for missing weeks, duplicate entries, or formatting issues such as commas in column headers or entity names.
In my test, GPT detected and corrected formatting problems automatically. However, starting with clean input data improves reliability and reduces the chances of errors during analysis.
Step 3: Upload the dataset to GPT-4o
Use GPT-4o with the Advanced Data Analysis model. After uploading your CSV, use a prompt like: “I have weekly ads data. Can you perform a seasonality decomposition on it?”
GPT will load your data and ask which metric you want to analyze. You can choose clicks, conversions, or any other time-based KPI included in your report.

Then it asked me which of the KPIs I wanted to analyze for seasonality and replied with: “The data has been cleaned and displayed for your review. Now, I’ll perform the seasonal decomposition on one of the metrics, like Clicks or Conversions, depending on which one you’d prefer to analyze. Should we proceed with Clicks, or would you prefer a different metric?”
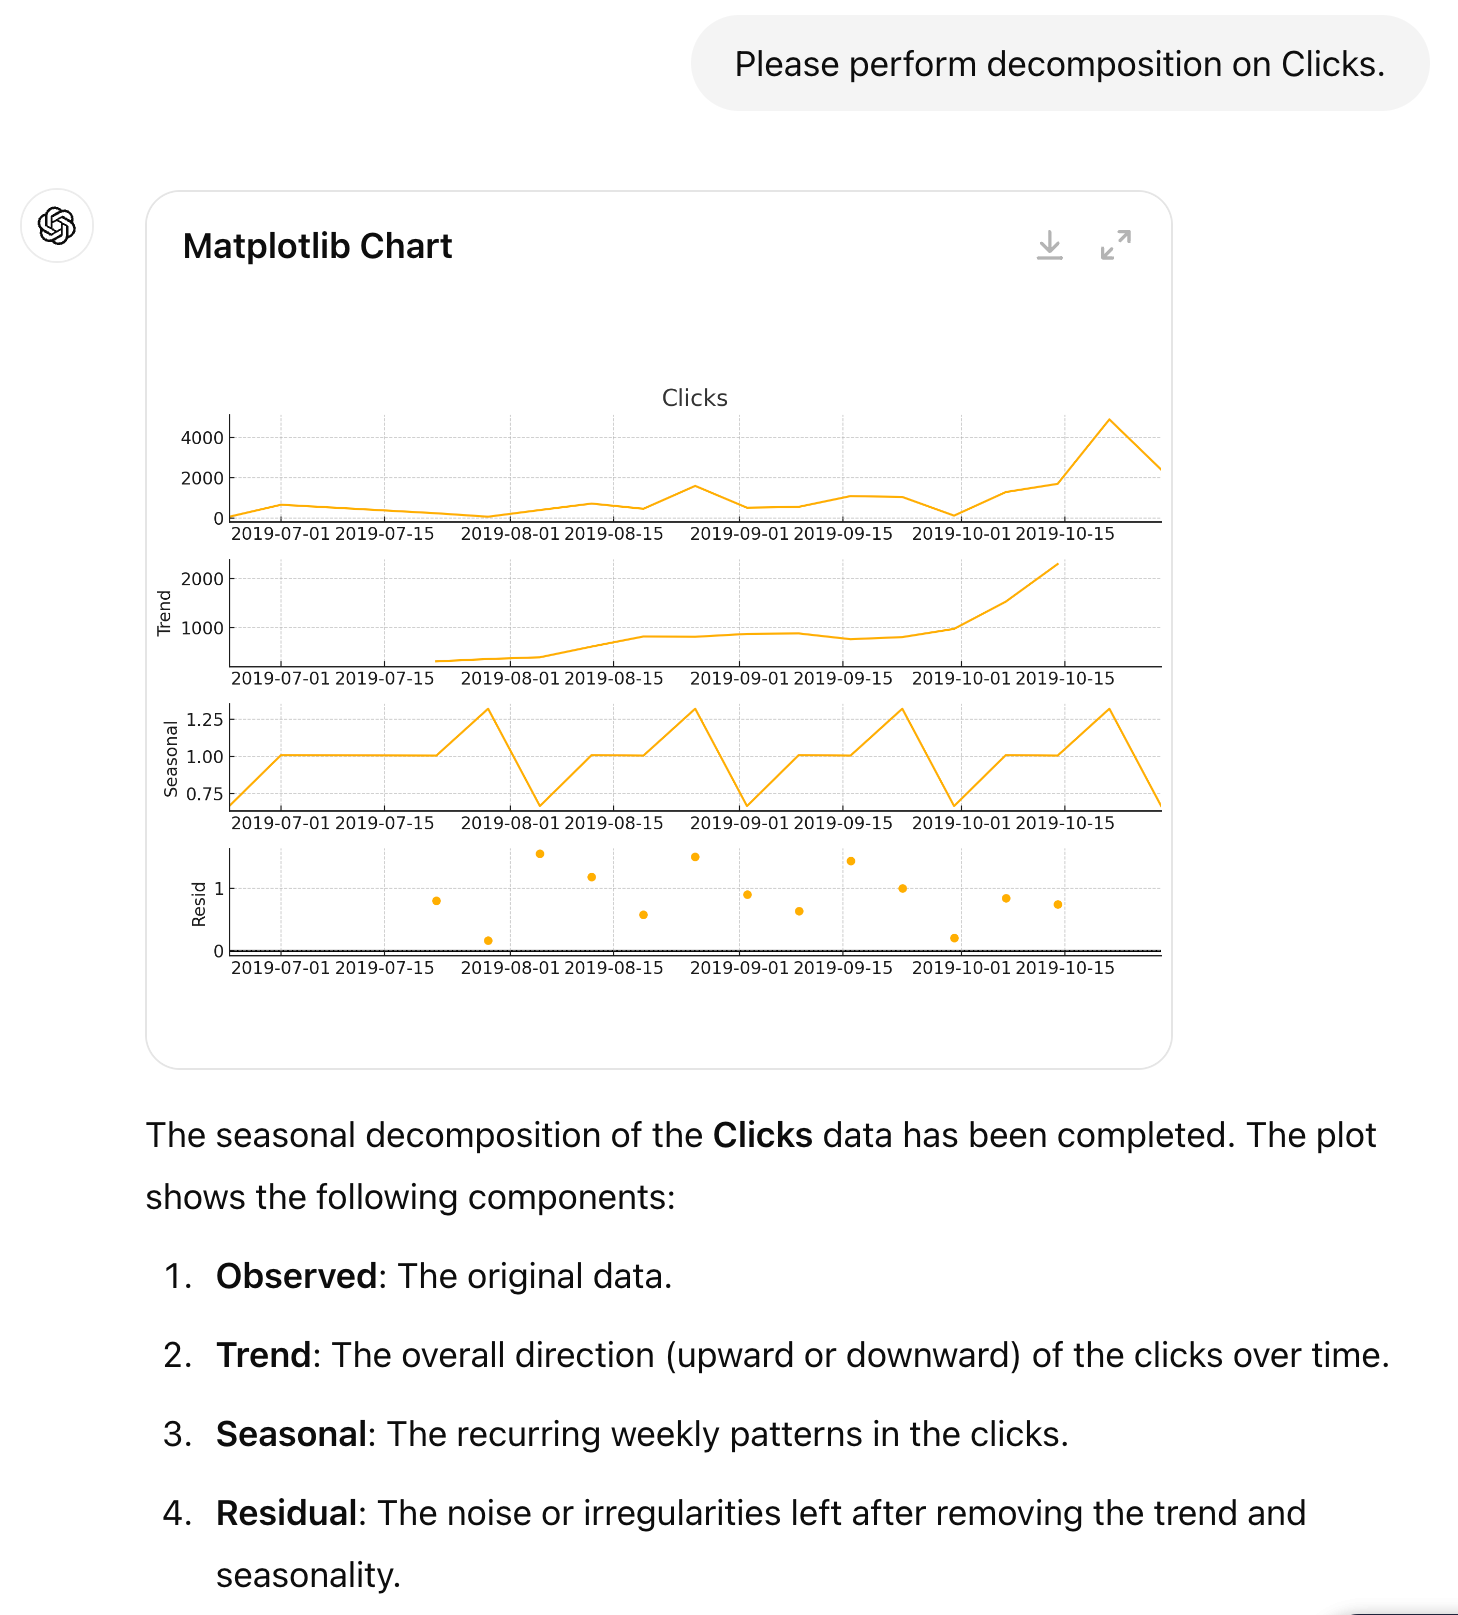
I responded with the prompt: “Please perform decomposition on Clicks.”
GPT then responded with the following chart:
Additional tips:
If you want to explore the underlying trends, seasonal patterns, and residual variations in your dataset (like clicks, conversions, or other metrics) across weekly time periods, you can perform time series decomposition.
- Clicks Decomposition Example: Decompose your clicks data to understand the trends (e.g., steady growth or decline over time), seasonal patterns (e.g., weekly or monthly peaks and troughs), and residuals (random fluctuations).
- Data Characteristics: Based on your uploaded data (with Week as a time series indicator), decomposition can show how much of your clicks or conversions are driven by long-term trends versus recurring patterns.
- Model Type: You can use an additive model if the seasonal variation remains consistent over time. Alternatively, use a multiplicative model if the variation grows proportionally with the level of the data (for example, during periods of high traffic).
There are several ways to expand on this.
Analyze by product lines or business segments
- Break Down by Product Categories: Segment your analysis by product lines or business units instead of looking at overall data. This helps identify which products or services are more seasonally affected, allowing for precise budget allocation.
- Sample Prompt: “Can you help me run a seasonality decomposition on my weekly data, but split by product categories?”
Brand vs. Non-brand analysis
- Compare Performance: Separate your data into brand and non-brand traffic or sales, then decompose each time series. This can reveal if branded campaigns follow different seasonal patterns than non-branded ones.
- Sample Prompt: “Can you help me decompose my time series data into brand and non-brand categories?”
Agency-level analysis: Vertical vs. advertisers
- Vertical Trends vs. Individual Clients: As an agency, you can run a vertical-wide seasonality analysis and then compare individual advertiser data against these industry benchmarks. This allows you to provide insights into how clients perform relative to the industry and make tailored recommendations.
- Sample Prompt: “Can you help me analyze a vertical’s seasonality and compare individual advertiser data to it?”
Forecasting PPC budget requirements
- Predict Budget Needs: Use the trend and seasonal components to forecast future performance. This will help you predict when budget increases will be necessary to maximize return on ad spend (ROAS). This is particularly useful for managing Q4 budgets effectively.
- Sample Prompt: “Can I use the trend and seasonal data to forecast my PPC budget requirements for the upcoming months?”
Seasonality insights for inventory management
- Optimize Stock Based on Seasonality: For businesses with physical or e-commerce products, understanding seasonality can help forecast inventory needs, ensure enough stock during peak periods, and reduce surplus during off-peak times.
- Sample Prompt: “Can seasonality analysis help me forecast inventory requirements by product line?”
Optimize marketing strategies
- Tailor Campaigns to Seasonal Peaks: Use the seasonal component to adjust your PPC or display advertising strategies, targeting higher-intent periods for specific products, and plan remarketing efforts during off-peak times.
- Sample Prompt: “Can you suggest strategies to adjust my marketing campaigns based on seasonal trends?”
Cross-compare channels
- Analyze Seasonality Across Multiple Channels: To gain deeper insights into your marketing efforts, you can run seasonality analysis across different channels (e.g., Google Ads, Facebook Ads, organic traffic) to identify patterns such as which channels perform best at different times of the year. This lets you optimize your ad spend and focus on the most effective platforms during key periods.
This process is made easier by simply swapping the datasets you use for each channel. Whether you’re analyzing clicks, impressions, or conversions for Google Ads or Facebook Ads, the same approach applies; just change the dataset to reflect the relevant channel.
- Sample Prompt: “Can you help me run seasonality analysis across different marketing channels?”
Fine-tune your PPC campaigns for maximum efficiency.
You already have the data. Seasonality analysis turns it into leverage.
It’s how you stop chasing performance and start anticipating it. With a single GPT prompt, you can surface trends your competitors are still guessing at. Forecast demand. Time your spend. Outsmart seasonality instead of getting blindsided by it.
No more “gut feels.” No more blown Q4 budgets. No more surprises.
Just sharper campaigns, better timing, and marketing that actually plans ahead.
You’re not just reacting to seasonality. You’re using it.


